Why
How
Future Work
ALmond Overview
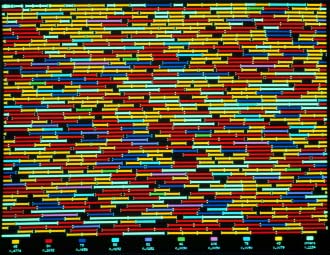
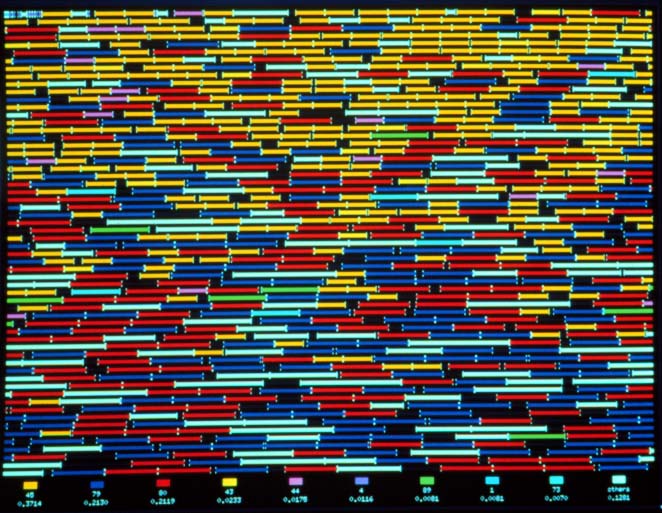
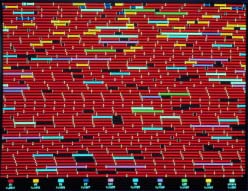 Hosts, red, are very common. Parasites, yellow, have appeared but are
still rare.
Medium resolution (33798 bytes).
Higher resolution (87505 bytes).
Hosts, red, are very common. Parasites, yellow, have appeared but are
still rare.
Medium resolution (33798 bytes).
Higher resolution (87505 bytes).
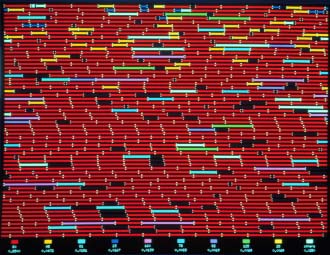
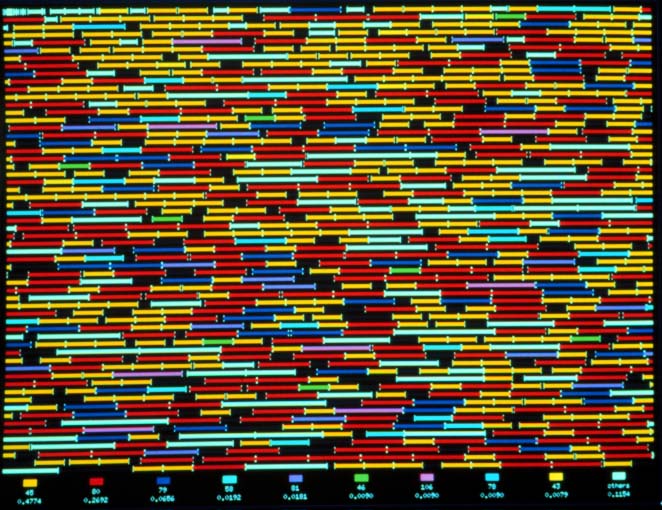
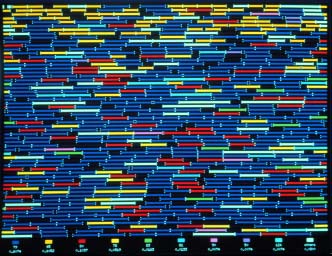
 Hosts, are now rare because parasites have become
very common. Immune hosts, blue, have appeared but are rare.
Medium resolution (39274 bytes).
Higher resolution (105636 bytes).
Hosts, are now rare because parasites have become
very common. Immune hosts, blue, have appeared but are rare.
Medium resolution (39274 bytes).
Higher resolution (105636 bytes).
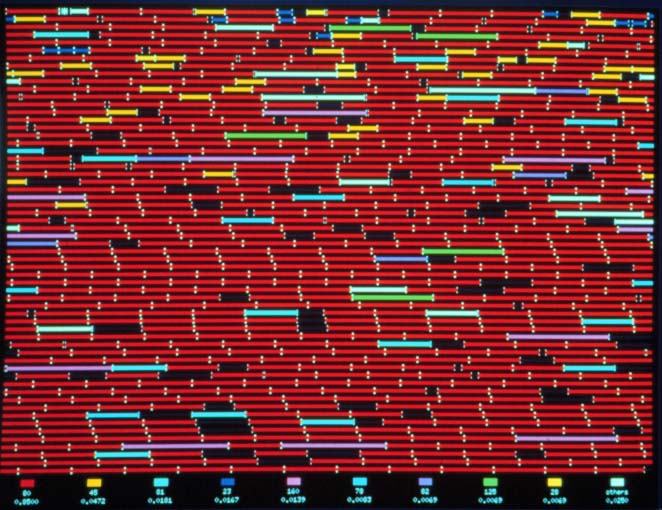
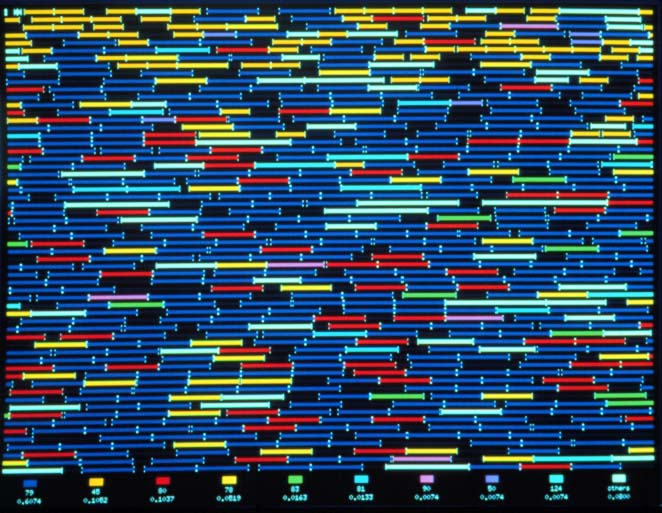
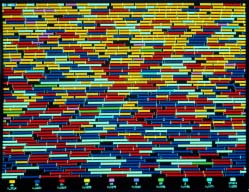 Immune hosts are increasing in frequency, separating the
parasites into the top of memory.
Medium resolution (38397 bytes).
Higher resolution (101459 bytes).
Immune hosts are increasing in frequency, separating the
parasites into the top of memory.
Medium resolution (38397 bytes).
Higher resolution (101459 bytes).
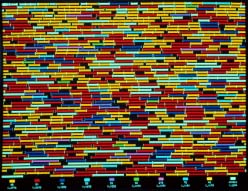
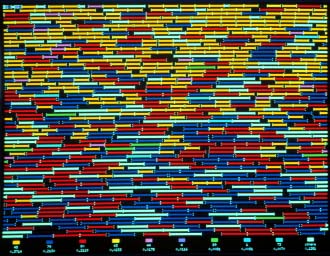
 Immune hosts now dominate memory,
while parasites and susceptible hosts decline in frequency. The parasites
will soon be driven to extinction.
Medium resolution (35956 bytes).
Higher resolution (91814 bytes).
Immune hosts now dominate memory,
while parasites and susceptible hosts decline in frequency. The parasites
will soon be driven to extinction.
Medium resolution (35956 bytes).
Higher resolution (91814 bytes).
Anti-Gravity Animation
Feel free to reproduce or publish these images, make photo credits to: Anti-Gravity Workshop
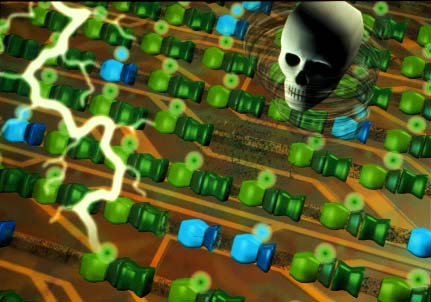
 The Digital Environment: Self-replicating computer programs (colored
geometric objects) occupy the RAM memory of the computer (orange background).
Mutations (lightning) cause random changes in the code.
Death (the skull) eliminates old or defective programs.
Medium resolution (29918 bytes, 431x302).
Higher resolution (74049 bytes, 864x602).
The Digital Environment: Self-replicating computer programs (colored
geometric objects) occupy the RAM memory of the computer (orange background).
Mutations (lightning) cause random changes in the code.
Death (the skull) eliminates old or defective programs.
Medium resolution (29918 bytes, 431x302).
Higher resolution (74049 bytes, 864x602).
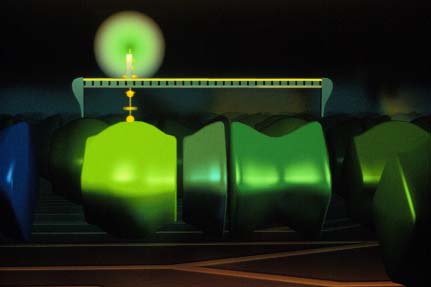
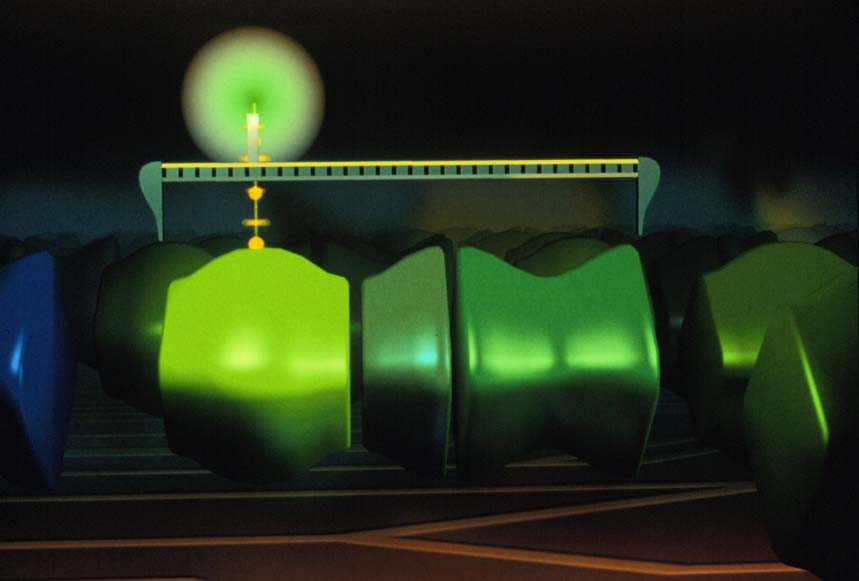
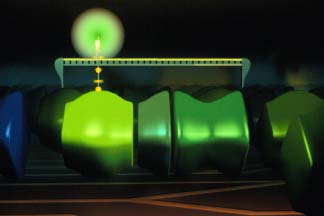 The Ancestral Program - consists of three ``genes'' (green solid objects).
The CPU (green sphere) is executing code in the first gene, which causes
the program to measure itself.
Medium resolution (11169 bytes).
Higher resolution (30463 bytes).
The Ancestral Program - consists of three ``genes'' (green solid objects).
The CPU (green sphere) is executing code in the first gene, which causes
the program to measure itself.
Medium resolution (11169 bytes).
Higher resolution (30463 bytes).
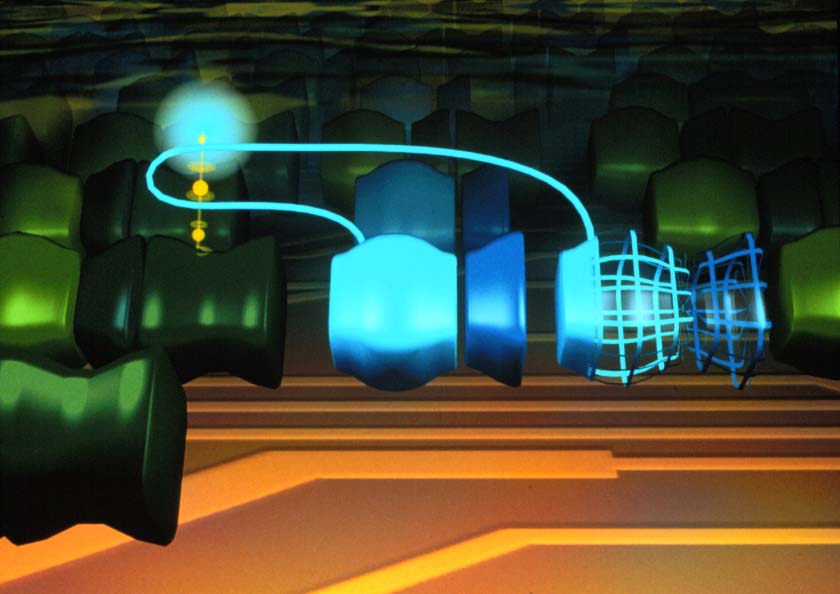
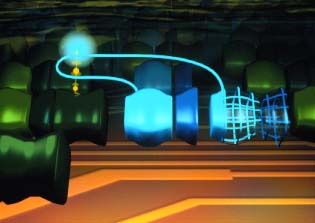 A Parasite (blue, two piece object) uses its CPU (blue sphere) to execute
the code in the third gene of a neighboring host organism (green) to
replicate itself, producing daughter parasite (two-piece wire frame object).
Medium resolution (18826 bytes).
Higher resolution (47741 bytes).
A Parasite (blue, two piece object) uses its CPU (blue sphere) to execute
the code in the third gene of a neighboring host organism (green) to
replicate itself, producing daughter parasite (two-piece wire frame object).
Medium resolution (18826 bytes).
Higher resolution (47741 bytes).
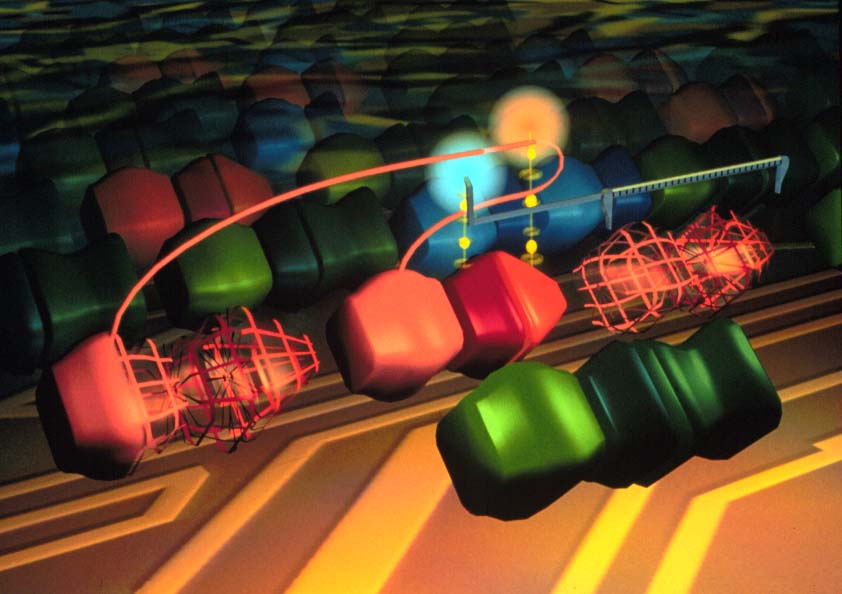
 A Hyper-parasite (red, three piece object) steals the CPU from a parasite
(blue sphere). Using the stolen CPU, and its own CPU (red sphere) it is
able to produce two daughters (wire frame objects on left and right)
simultaneously.
Medium resolution (22537 bytes).
Higher resolution (57578 bytes).
A Hyper-parasite (red, three piece object) steals the CPU from a parasite
(blue sphere). Using the stolen CPU, and its own CPU (red sphere) it is
able to produce two daughters (wire frame objects on left and right)
simultaneously.
Medium resolution (22537 bytes).
Higher resolution (57578 bytes).
Visualization of the Tierra Network
These are two images from the VRML Visualization of Network Tierra. This visualization represents the Tierra network environment though the ``eyes'' of the digital organisms themselves. Digital organisms are able to perceive conditions on the net by using the TPing sensory mechanism (sort of like echo location in bats). These images visualize the data provided by TPing.
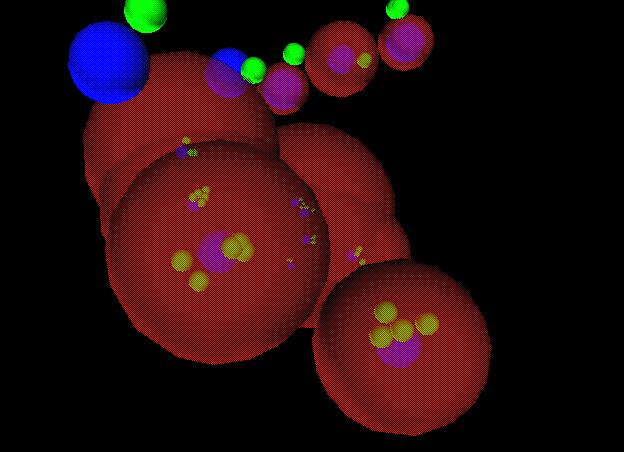 Close up view of Network Tierra visualization. The diameter of the
orange sphere is proportional to the amount of memory available to
the digital organisms on a node (the soup size); the diameter of
the blue sphere (usually) within the orange sphere represents the
speed of the processor, measured as virtual machine instructions
executed per second; around each blue sphere is a cluster of
yellow-green spheres, each of these represents the presence of
one hundred digital organisms in that soup. Not that the node
represented by the spheres on the lower right of the image has
four yellow-green spheres, indicating the presence of four hundred
digital organisms on that machine. In the upper left is a machine
with a small soup and a fast processor, so the small orange sphere is
hidden inside the large blue sphere, and being a small soup, there
are only one hundred digital organisms on that machine (note one
yellow-green sphere).
Close up view of Network Tierra visualization. The diameter of the
orange sphere is proportional to the amount of memory available to
the digital organisms on a node (the soup size); the diameter of
the blue sphere (usually) within the orange sphere represents the
speed of the processor, measured as virtual machine instructions
executed per second; around each blue sphere is a cluster of
yellow-green spheres, each of these represents the presence of
one hundred digital organisms in that soup. Not that the node
represented by the spheres on the lower right of the image has
four yellow-green spheres, indicating the presence of four hundred
digital organisms on that machine. In the upper left is a machine
with a small soup and a fast processor, so the small orange sphere is
hidden inside the large blue sphere, and being a small soup, there
are only one hundred digital organisms on that machine (note one
yellow-green sphere).
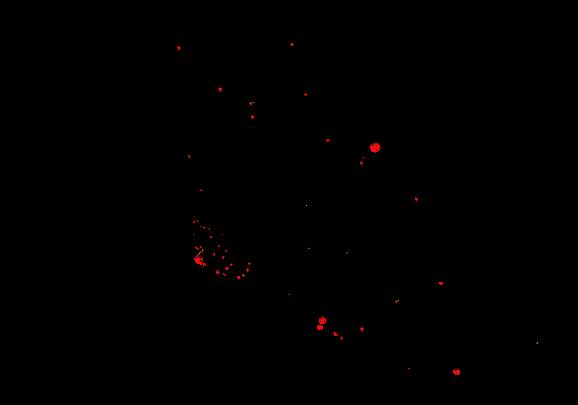 Wide view of Network Tierra visualization. This is a view of
a medium sized Tierra network, with about one hundred participating
machines. The machines are located at ATR in Japan,
The University of Delaware, The Santa Fe Institute,
The Free University of Brusells,
and the Swiss Federal Institute in Lausanne.
Each machine is visualized as a set of spheres (one
orange, one blue, and a few yellow-green), as described above.
The network is represented from the perspective of one digital
organism, located on a specific machine (in Santa Fe).
The spheres representing the hundred machines are arranged onto
the surface of a cone, with the point-of-view machine at the
tip of the cone (a little below and left of center). The remaining
machines are arranged in spirals on the surface of the cone,
but with their distance from the tip proportional to the time
that it takes the TPing message to cross the net and return.
This network transit time is the most meaningful measure of
distance on the network, and it is provided with the TPing data.
Wide view of Network Tierra visualization. This is a view of
a medium sized Tierra network, with about one hundred participating
machines. The machines are located at ATR in Japan,
The University of Delaware, The Santa Fe Institute,
The Free University of Brusells,
and the Swiss Federal Institute in Lausanne.
Each machine is visualized as a set of spheres (one
orange, one blue, and a few yellow-green), as described above.
The network is represented from the perspective of one digital
organism, located on a specific machine (in Santa Fe).
The spheres representing the hundred machines are arranged onto
the surface of a cone, with the point-of-view machine at the
tip of the cone (a little below and left of center). The remaining
machines are arranged in spirals on the surface of the cone,
but with their distance from the tip proportional to the time
that it takes the TPing message to cross the net and return.
This network transit time is the most meaningful measure of
distance on the network, and it is provided with the TPing data.